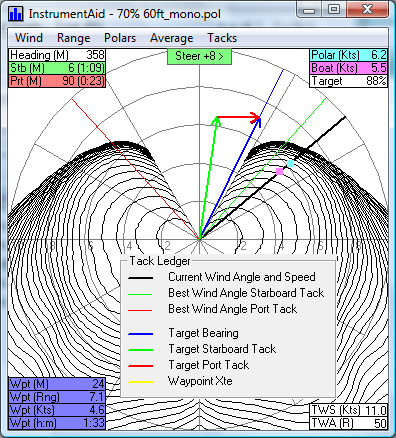
The optimized tack angles and time on each tack is computed from performance polars and the user specified course or NMEA waypoint. The dashed green line shows the ideal wind angle for a starboard tack, and the dashed red line shows the ideal wind angle for a port tack.
In the sample shown here, the waypoint course is 24 degress and range of 7.1 nautical miles, and shown by the blue arrow. The boat is sailing on a starboard tack at a heading of 358 degrees. For these sample conditions the optimized tacking data is composed of two parts:
The predicted average velocity made good is 4.6 kts for both tacks.
The green steer label indicates that the boat should turn 8 degrees to starboard for optimum performance. By heading up the boat will slow down on the starboard tack, but make better velocity to the desired waypoint.
Home | Previous | Next