12/22/2010
To optimize your use of ChartAid, you might consider the following:
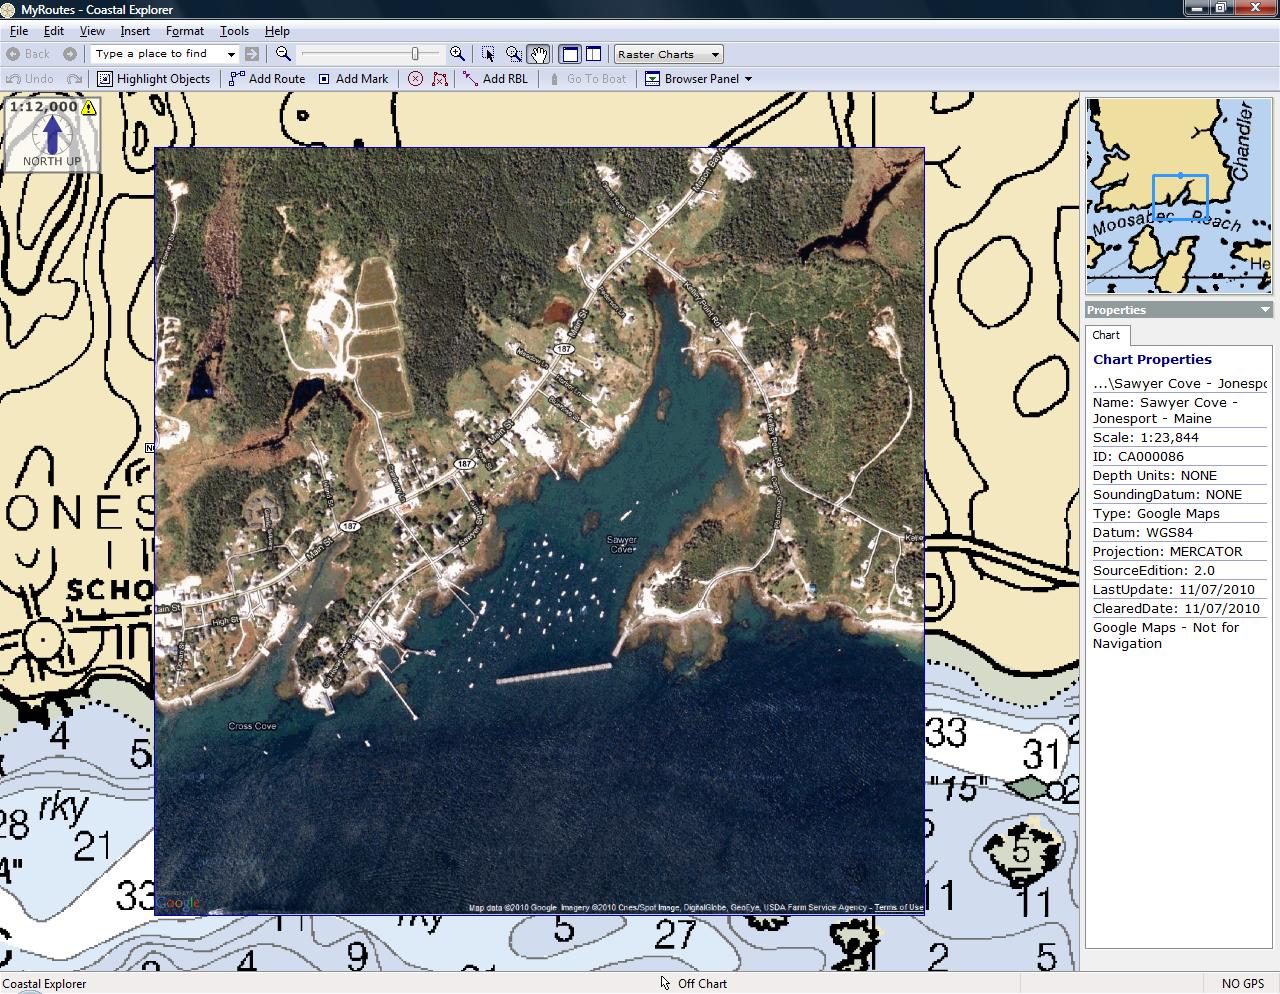
For areas where your charts are acceptable and you just want to augment a particular anchorage or marina, a single chart with high resolution is quick and simple.
The picture on the left is of the Sawyer Cove area in Maine. Here the NOAA charts of the overall area are acceptable; ChartAid offers extra details of the Sawyer Cove.
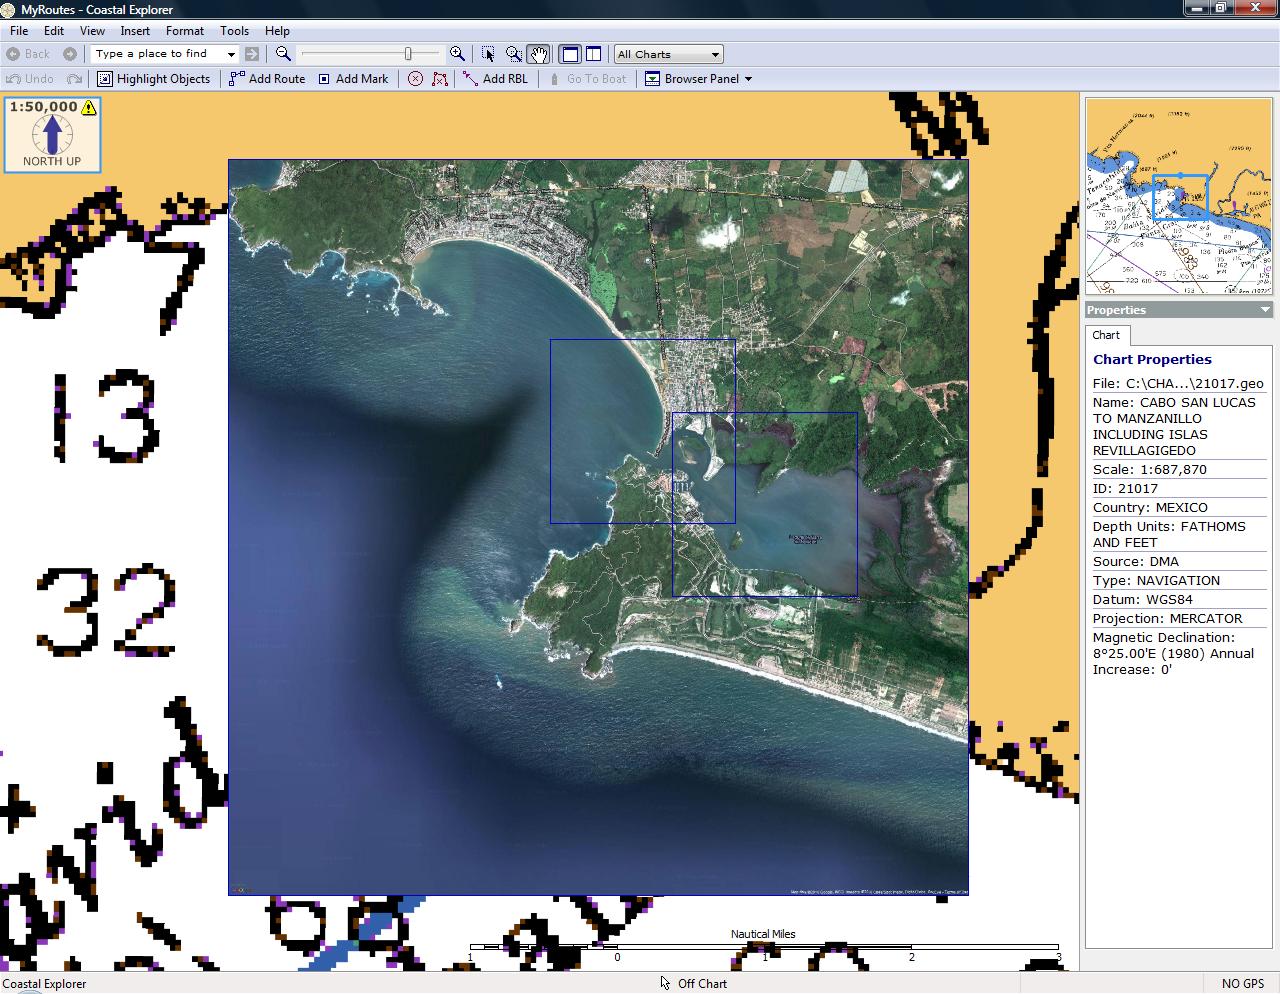
For areas where the charts are not good, instead of generating one large high resolution chart, it may be better to generate a large area chart with lower resolution and then for selected portions, smaller area charts with high resolution. This approach often makes the charts smaller and provides more details of your high interest areas.
The picture on the left is a screen shot of Navidad Bay, Mexico. Here the SoftCharts of the overall area are poor. The generated ChartAid charts consist of one overview chart of low resolution to define the area and high resolution charts (as outlined in blue) of the marina and lagoon.
Home | Previous | Next