6/1/2012
To supplement your information about a particular area it can be useful to have one area overview chart with low resolution along with several smaller charts with higher resolution to cover anchorages, passes and/or marinas. The Multiple Charts using Area Boundary feature of ChartAid provides a simple four-step method to produce these charts:
As an example, consider the San Juanico area in Mexico's Sea of Cortez. The major points of interest in the San Juanico area include an anchorage to the north and a banana shaped bay. To cover the San Juanico area, it would be helpful to have one large low resolution chart of the overall area plus some high resolution charts to cover the anchorages. Outlined below are the steps required to easily produce these charts.
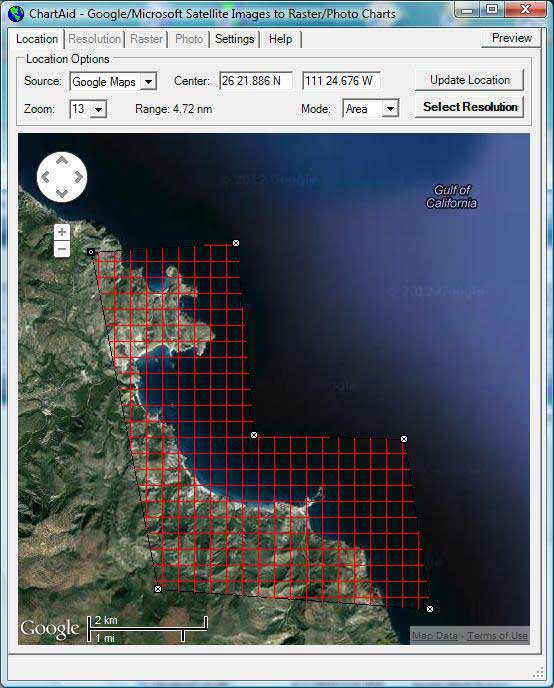
The first step is to select the desired source and area of interest as usual. Then select 'Area' in the 'Mode' box and fine tune this area by constructing a boundary around the places that are of particular interest.
Shown on the left is a screen shot of step one.
A graphical user interface is provided to help with the construction of the boundray. You can easily add, remove or move boundary points. You can also zoom in/out and pan the display to fine tune the area boundary.
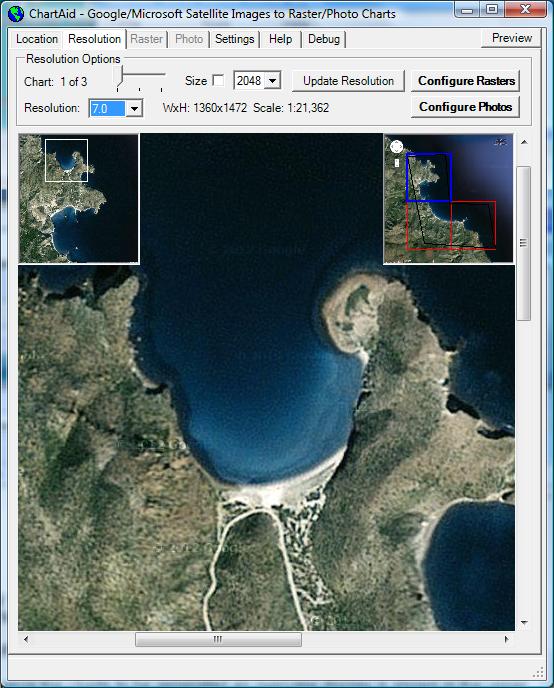
The second step is to select the resolution and the type of charts. The number of charts is determined by the resolution and the area boundary coverage.
Shown on the left is a screen shot of step two.
To help you visualize the charts to be generated an overview display is shown in the upper right corner. This display shows the overall area of the charts along with an outline of each of the charts. The current chart visible on your screen is outlined in blue while the other charts are outlined in red.
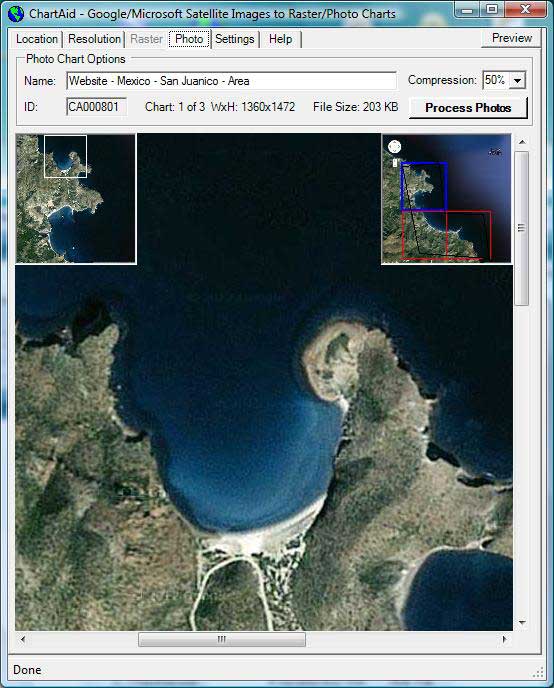
The third step is to specify the charts' area name and select the compression level. All the charts will use the same compression level. The charts will all have the same area name with a number appended to the chart name to uniquely identify each individual chart.
Shown on the left is a screen shot of step three for Photo Charts.
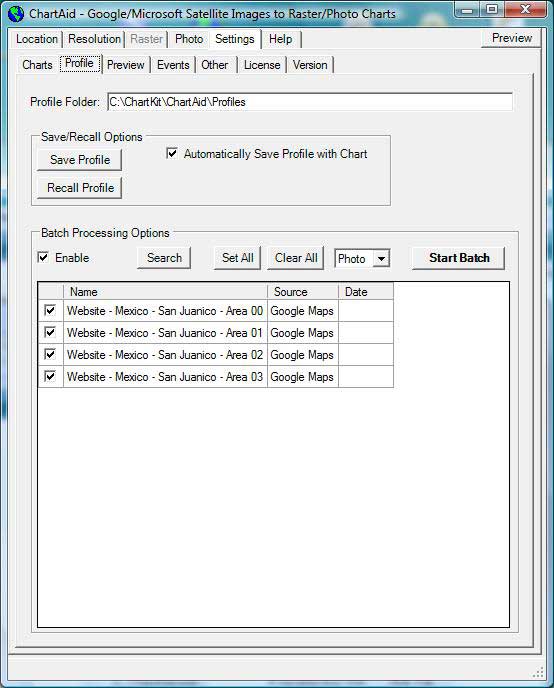
The fourth step is to generate and save the charts. This is done by using ChartAid's batch processing feature.
Shown on the left is ChartAid's Batch Processing window for step four. In this example four charts will be processed: one low resolution area overview chart and three detailed charts.
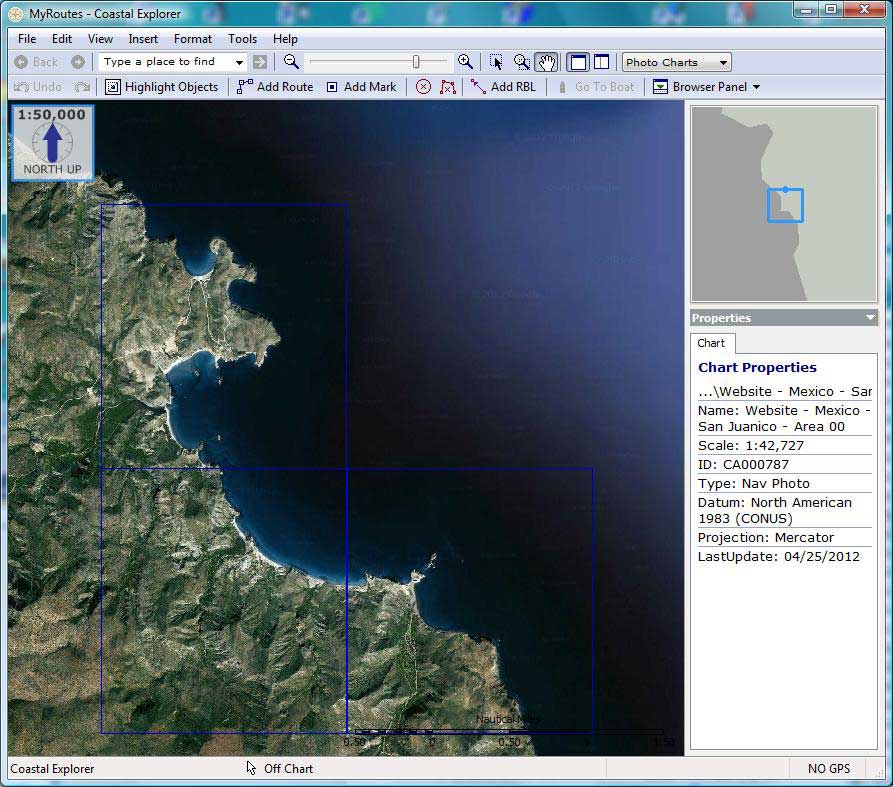
The picture on the left shows the four processed charts as viewed with Coastal Explorer: area overview chart for the area along with three detailed charts. The borders of the charts are outlined in blue.
You can click on the picture for a larger view of the processed charts.
Home | Previous | Next