Image Source - Google Maps
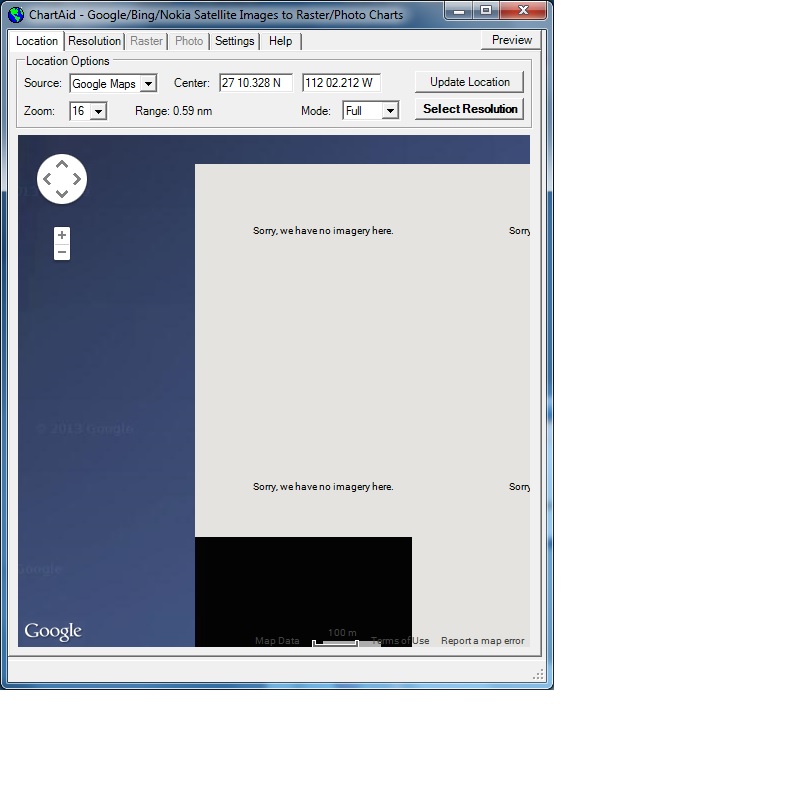
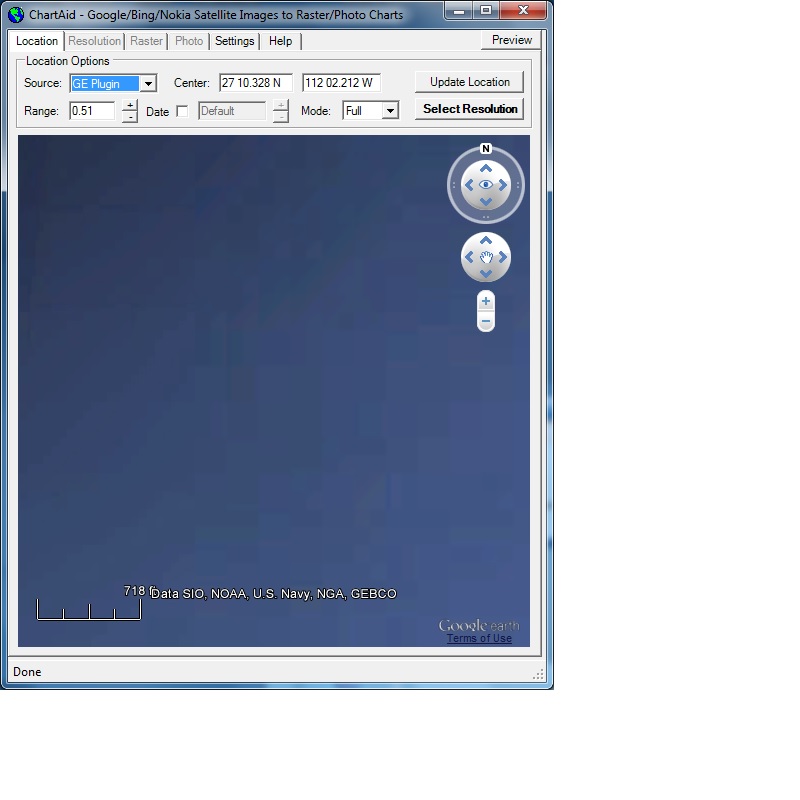
Image Source - Google Earth
4/22/2014
ChartAid supports several different printable images. Depending on which image source you use, you will get a different result if you over zoom.
For example, if you over zoom a Google Maps image, Google Maps will display a blank section and/or a warning text such as "Sorry, we have no imagery here." In contrast, if you over zoom a Google Earth image, Google Earth will simply expand the existing image to cover the display.
Shown below are two resulting display images for the same location, zoom factor and range but using different image sources. The first sample is with Google Maps and the second sample is with Google Earth.
Image Source - Google Maps
|
Image Source - Google Earth
|
If you are creating just one or two charts for a location then the blank or warning sections on the charts might be acceptable. However, if you are creating multiple charts for a location that result in blanks or warning sections on the charts, it may be confusing and/or disruptive when viewing these charts with your navigation program. Most navigation programs will show an overview chart (having no blanks) but will show blank areas as you zoom in or change the displayed area.
Shown below are two samples that display multiple area images for the same location and resolution but using different image sources. The first sample is with Google Maps and the second sample is with Google Earth.
Image Source - Google Maps
|
Image Source - Google Earth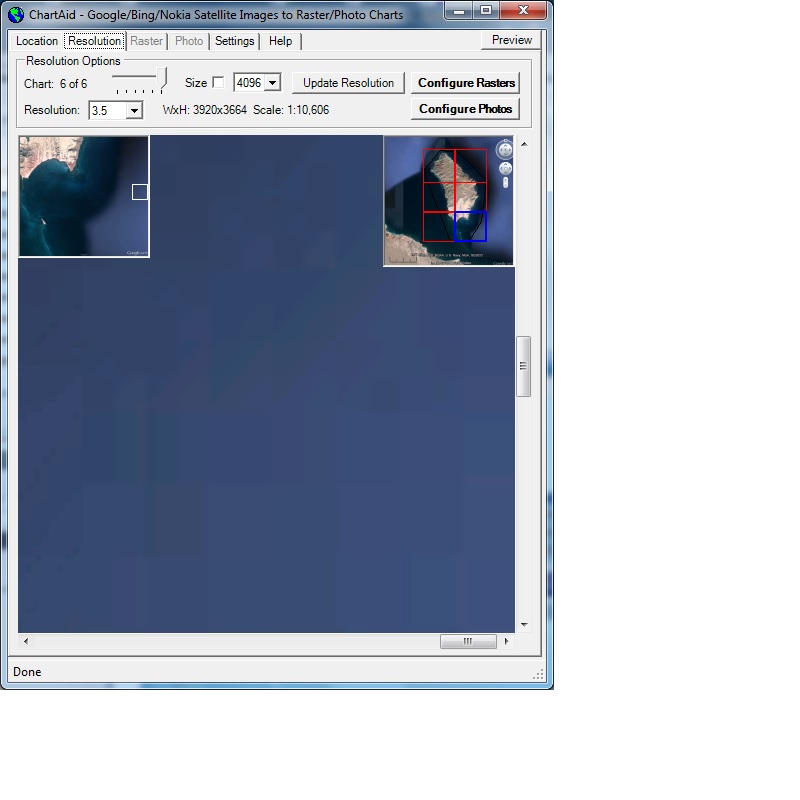
|
Home | Previous | Next