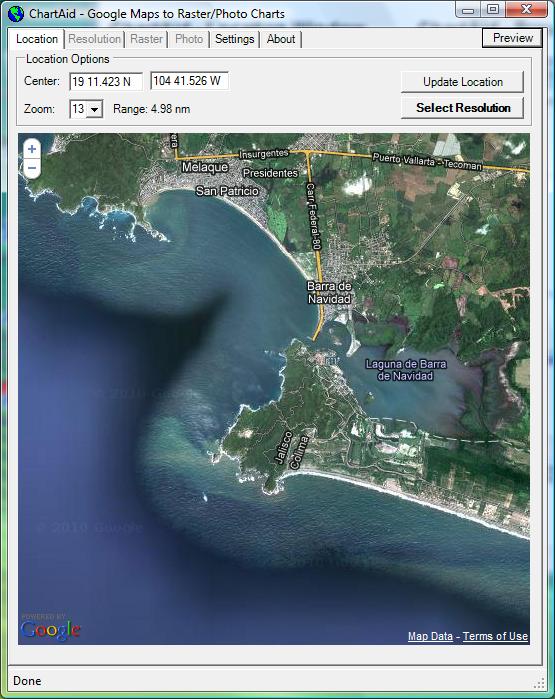
ChartAid - Location Window
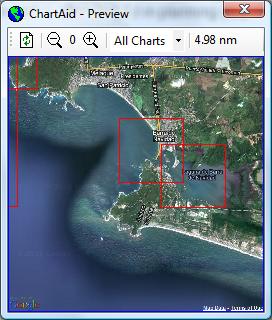
ChartAid - Preview Window
1/4/2011
When you want to generate multiple charts for an area it is often helpful to view the current chart in relation to other charts that you have already generated. The ChartAid Preview Window provides that perspective.
As an example, suppose you had previously generated high resolution detailed Photo Charts for the marina and lagoon areas near the Navidad Bay, Mexico. Now you want to generate a larger chart to cover the whole bay but still include the marina, lagoon and anchorage just west of the bay.
The ChartAid Location Window and Preview Window used to generate this new chart are shown below. You can zoom in and out or pan the Preview Window to get a better prespective of the new chart in relation to the other charts. The Preview Window also tracks any changes you make in the Location Window or Resolution Window.
The Preview Window outlines in red previously generated charts and outlines in blue your current chart. As you move the cursor to a particular location, information about the chart for that location is dislayed. This information includes chart name, scale and resolution and is often helpful in planning your new chart.
ChartAid - Location Window
|
ChartAid - Preview Window
|
Below are screen shots as displayed by Coastal Explorer before and after the new chart was generated.
Coastal Explorer - Before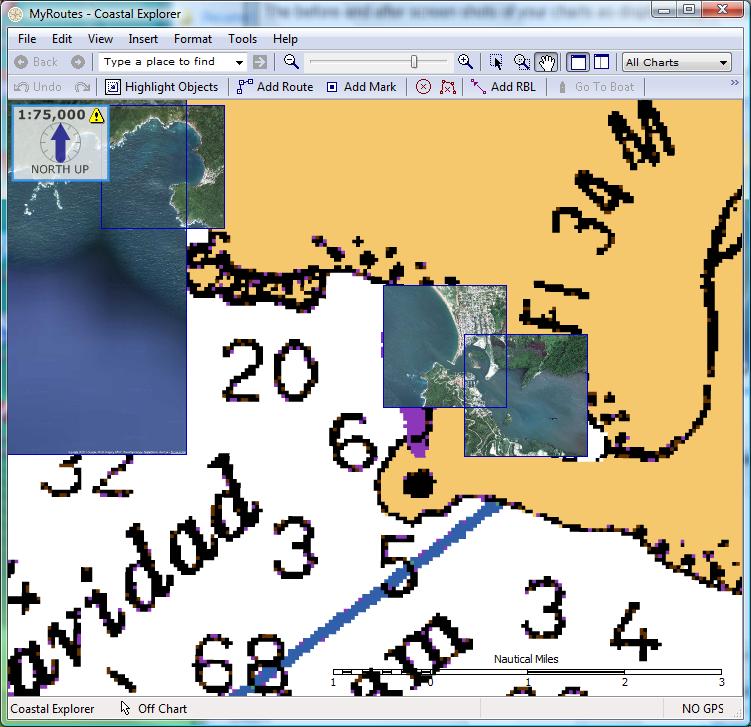
|
Coastal Explorer - After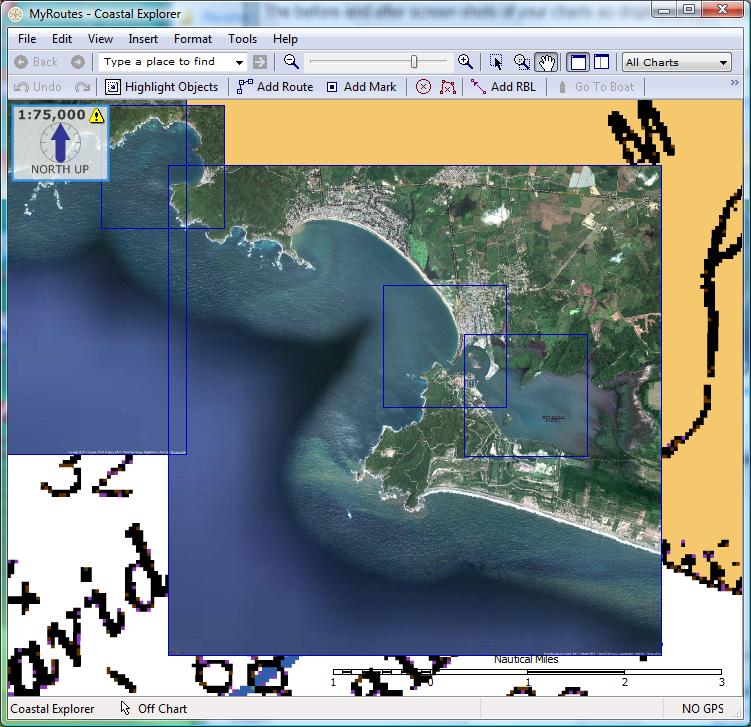
|
Home | Previous | Next