6/1/2012
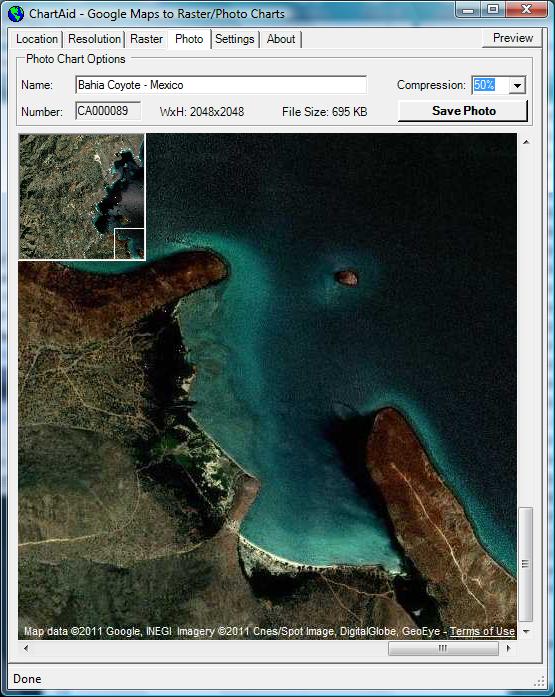
The third step is to name the chart, select the compression level and save the chart. For some images the compression level makes a difference in quality; for others quality is maintained even with a high level of compression. By adjusting the compression level it is often possible to reduce the file size by a factor of 10 without loss in quality.
The picture on the left is a screen shot of step three for Photo Charts.
To define the desired compression level, select from the choices in the pull-down. As you change the compression level the displayed image and file size will reflect your choice.
As with the Resolution Window, an overview of the chart image and scroll bars are provided to aid in previewing the magnified chart image of your selected area. What you see here is what you will see when you zoom in on the saved chart.
After selecting the compression level press the 'Save Photo' button.
Note A: If you are using Nobeltec, please note the following special considerations for Photo Charts.
Note B: If your navigation program supports both Photo Charts and Raster Charts, you may prefer Photo Charts over Raster Charts. Photo Charts are often 6 to 10 times smaller in size than comparable Raster Charts. In addition, some navigation programs (for example, Coastal Explorer and Nobeltec) allow you to toggle between Vector Charts, Raster Charts and Photo Charts to get the best information.
Home | Previous | Next